According to a recent survey, 69% of development teams spend at least one day a week fixing code-related issues. 30% of software professionals consume even more time than that weekly.
DevOps teams face the same challenges fixing issues on Kubernetes (or k8s). Although k8s offers an exhaustive toolset for building pipelines’ infrastructure, it lacks an essential component: troubleshooting. As a result, resolving problems on Kubernetes is cumbersome.
To address that, DevOps teams need an efficient tool to handle this critical component and include it in their tool stack.
In this post, we’ll explore that tool, including the system changes DevOps teams often troubleshoot and why fixing cloud or virtual systems is complicated.
What changes can happen, and why should DevOps teams care?
Troubleshooting an issue is like putting on the detective hat and looking for the source of the problem. It can be:
- Code deployment (the most frequent root of an incident)
- Configuration modifications
- Cloud infrastructure changes, etc.
Quickly uncovering the root cause of these incidents is critical so DevOps teams can focus on their ongoing tasks. Unfortunately, when troubleshooting in k8s, they manually perform several backtracks and reverse engineering. This eats up time, ruins the teams’ productivity, and wastes other valuable business resources.
Why troubleshooting cloud infrastructure is complicated
Troubleshooting modern systems is extremely time-consuming and intricate.
Software development and deployment pipelines handle volumes of code in several applications, microservices, and others, complicating troubleshooting.
What’s more, some tools don’t keep audit logs which leaves you with no trace of who modified what while other tools use too-sophisticated audit logging mechanisms, rendering the documentation unusable.
But here’s another problem: even if the system records the changes, you still need to open dozens of other tools and track the modifications. You would need sufficient expertise to navigate these programs and troubleshoot efficiently.
What modern troubleshooting looks like
How does the process of troubleshooting typically go for DevOps teams?
First, you get production alerts from Slack. You go to Epsagon, a tool that helps you better understand the monitor issues in your microservice environments. By this time, Epsagon will have shown you which microservices involved are experiencing problems.
Then, you check your Kubernetes and try to figure out what changed. From there, you head to your CI/CD pipeline to understand who deployed to production, including why and when. Next, you check Jenkins and find the latest job made.
You then track down the source code at GitHub — but seeing you can’t crack the problem, you ask your team at Slack who changed what and when, and who can help resolve the issue. You later discover that some unrelated service caused the ruckus and you missed the connection or adjustment on an irrelevant Github deployment.
As you can see, the whole troubleshooting process is inefficient and involves plenty of back-and-forth activities.
Remember, teams adopt a DevOps methodology and use k8s to respond to customer demands without fretting about infrastructure layers. If troubleshooting takes too long, it consequently impacts their client support delivery.
So, to streamline your k8s troubleshooting, you need to audit the changes — whether automatically or by following a defined process. Without efficient audits, troubleshooting will only continue becoming a headache.
Thankfully, there is a tool to help simplify it — and that’s Komodor.
How Komodor streamlines your Kubernetes troubleshooting
Komodor is a Kubernetes troubleshooting solution — the one tool your DevOps team is missing from its suite. It tracks all changes in your k8s stack, analyzes the ripple effect, and gives you the necessary context for troubleshooting.
This is how Komodor’s service explorer appears:
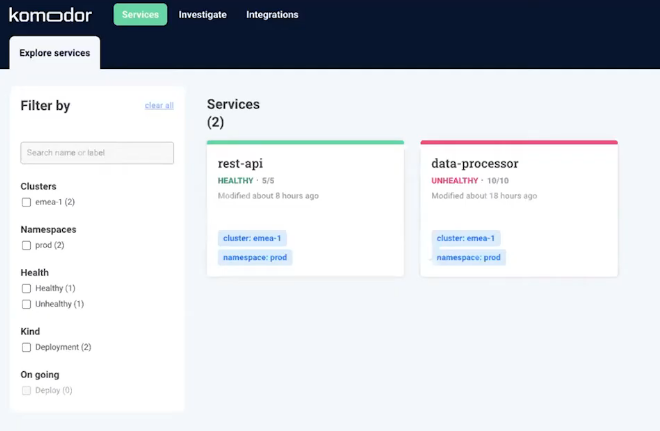
Komodor gives you a top-level view of your Kubernetes cluster and maps all services running in cross environments and cross clusters.
It also builds a complete timeline for each service that includes all significant elements, such as the changes, implications, and alerts happening under it.
Let’s take a look at an example. Here’s how the timeline looks for a “data-processor” service that had been previously detected as “unhealthy:”
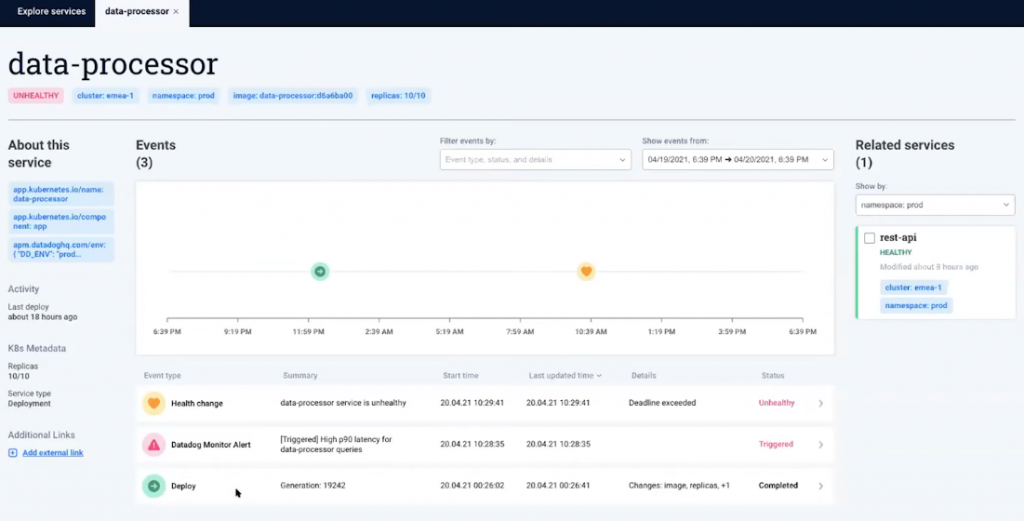
Komodor shows the microservice changes that have occurred in the past 24 hours: first, a deployment; then a Datadog alert after 10 hours.
To get to the root of the problem, Komodor lets you explore further. By clicking on the “rest-api,” you can see the changes in both microservices and the deployment happening before the issue emerged.
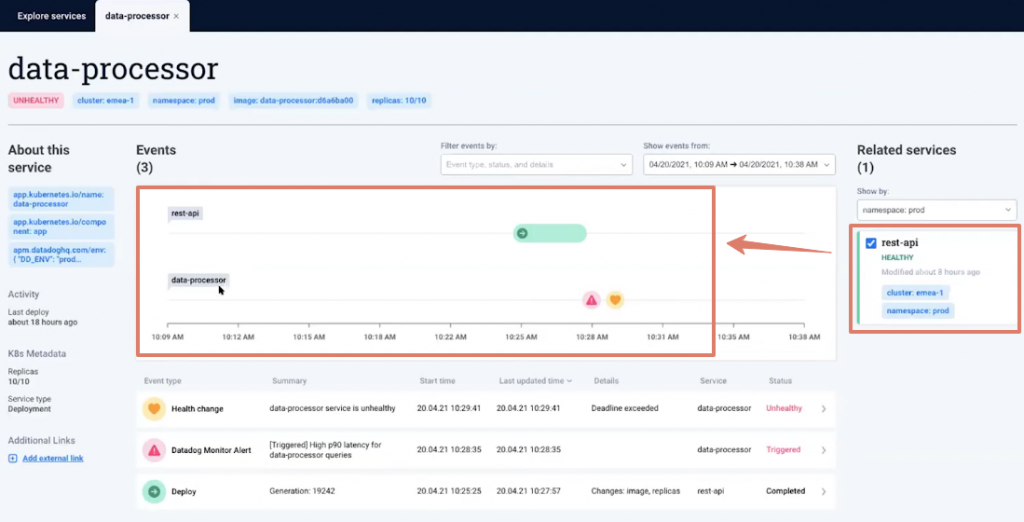
Clicking on the “Deploy” activity, a window appears at the right for details. Komodor then shows you that a code on Github changed from 50 to 5 replicas. This explains the issue you experienced.
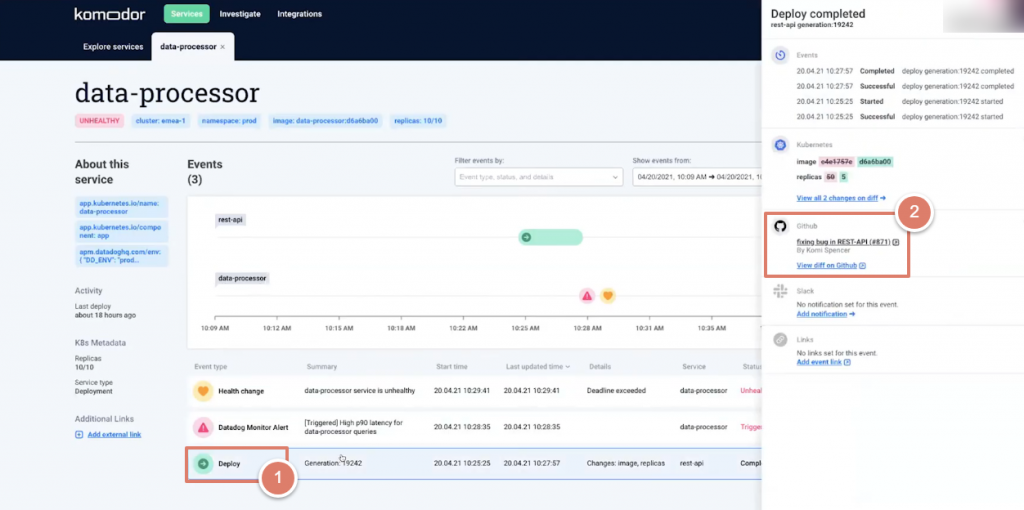
We see in this example how Komodor helps you understand your services’ behavior and the changes behind the issues detected on the platform. It even presents the data and events on an intuitive, visually-friendly dashboard.
Since Komodor installs an agent on top of your k8s cluster, it supports all that Kubernetes distributes on-premise and on the cloud. It can track any change in the k8s cluster — whether it’s deployment health, HPA, alerts on auditing tools, and more. It even supports feature flag changes, multiple clusters, hybrid environments, and so on.
Additionally, Komodor installation takes only five minutes, entirely covering k8s cluster changes instantly. It also integrates with numerous auditing solutions such as Epsagon, Opsgenie, Datadog, PagerDuty, New Relic, and more.