Are you an IT professional working with Kubernetes for a while or just starting with it? In both cases, it’s likely that you have probably been grinding with “kubectl” commands and learning your way towards different commands such as “get pods,” “create,” “delete pod,” etc. This is because these commands help us manage containerized applications. But have you wondered or tried to explore the Kubernetes dashboard?
While it is very important for users to learn these commands, sometimes, it is also essential to learn how to navigate and manage these containerized applications via a great UI like the Kubernetes dashboard. Even without having thorough knowledge, it is good to be aware of how to navigate it.
Understanding the advantages and limitations of the Kubernetes CLI and dashboard enhances our effectiveness in managing Kubernetes environments. Let’s explore this in more detail in this article.
What is the Kubernetes Dashboard?
Looking at the Kubernetes dashboard, most DevOps people and developers found it to be a friendly UI web-based application that helps manage the organizations’ Kubernetes clusters. In addition, it gives a visual overview of the applications running on different clusters and allows DevOps or developers to manage Kubernetes resources, logs, and access containers.
It is also a good thing to mention that the dashboard offers more accessibility features when managing clusters. However, it is not a replacement for the CLI. Remember that CLI remains indispensable for advanced configurations, automation, and particular operations that require fine-grained control. That’s why we can say that the Kubernetes dashboard enhances, rather than replaces, the CLI, making it more approachable for beginners or IT professionals who prefer interfaces for specific tasks.
Advantages and Disadvantages of Kubernetes Dashboard
It is essential to know the advantages and disadvantages of the Kubernetes dashboard. It is because it helps us make informed decisions about when, where, and how to use it effectively. Knowing its strengths can easily increase its effectiveness and efficiency, and of course, knowing its limitations helps to know where the dashboard may not meet specific needs, guiding us towards alternative tools.
Advantages of Kubernetes Dashboard
Kubernetes dashboard is a valuable tool for efficiently managing, troubleshooting, and quickly monitoring our cluster. Moreover, it offers a comprehensive overview of your cluster, including node, pod, and resource utilization metrics. It facilitates workload management (deployments, daemonsets), pod-level operations (logs, resource monitoring), and real-time CPU and memory usage metrics across pods and nodes. Furthermore, it supports namespace management, the creation of custom resource definitions for extended Kubernetes functionality, and RBAC-based access control for precise user and group permissions.
Disadvantages of Kubernetes Dashboard
Even though the Kubernetes dashboard provides accessibility to managing various aspects of Kubernetes clusters, it has some drawbacks:
- Overhead: Leveraging the “Kubernetes Dashboard” adds to the trail of your cluster with limited resource availability. It may mean that other workloads would have insufficient memory and CPU to perform at their best.
- Out-of-the-Box Functionality Limitation: The out-of-the-box functionality is okay. However, the Kubernetes dashboard doesn’t support advanced operations. Users must return to the CLI for advanced techniques and operations to perform or execute commands for “kubectl.”
Alternatives of Kubernetes Dashboard
Discussing alternatives to the out-of-the-box Kubernetes dashboard is another essential aspect. Again, the Kubernetes dashboard doesn’t allow users to execute advanced operations. Hence, they must return to the CLI for operations such as advanced networking configurations, detailed comprehensive logs, and security-policy enforcement. Thus, having an alternative is a good thing to explore.
An alternative to the Kubernetes dashboard may provide enhanced visibility and a more simplified and comprehensive experience. Users can have more customization options and enterprise-level support for new features that align the product with business needs.
Getting Started with Running Kubernetes Dashboard
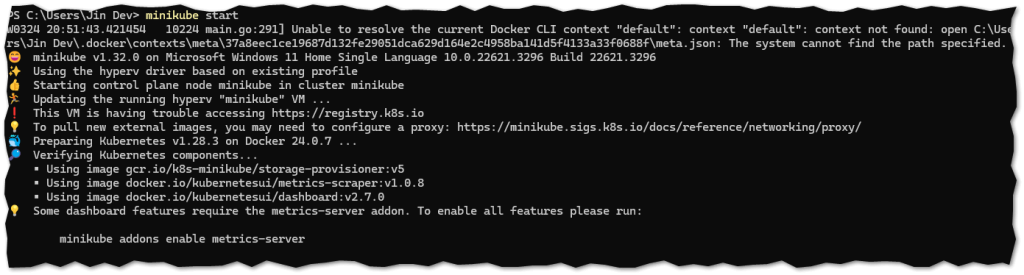
This section will explore how to run a Kubernetes Dashboard on your local machine using “minikube.” Please make sure you have installed it. You can click here to download it. First, start minikube.
Once you have started minikube, please look at the YAML files below and create them using kubectl”. Filename: “newpod.yaml”
| apiVersion: v1 kind: Pod metadata: name: nginx labels: name: myapp type: proxy-type spec: containers: – name: nginx-container1 image: nginx:latest resources: limits: memory: “128Mi” cpu: “500m” ports: – containerPort: 80 |
After you have created the file, please execute this command: kubectl create -f newpod.yaml
| Filename: “replicasets.yaml” apiVersion: apps/v1 kind: ReplicaSet metadata: name: myreplicaset spec: replicas: 3 selector: matchLabels: app: nginx template: metadata: name: proxy labels: app: nginx spec: containers: – name: nginx-container1 image: nginx:latest resources: limits: memory: “128Mi” cpu: “500m” ports: – containerPort: 80 |
Same here. kubectl create -f replicasets.yaml
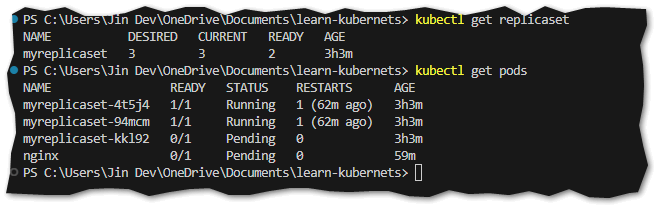
For us to see the pods and replicasets, execute the commands “kubectl get pods” and “kubectl get replicaset”.
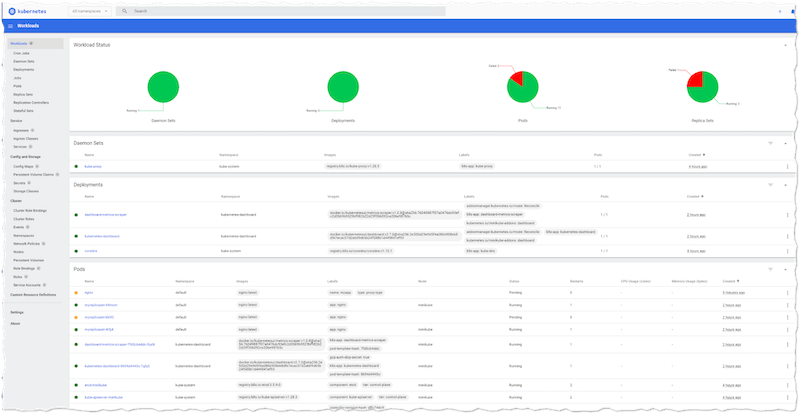
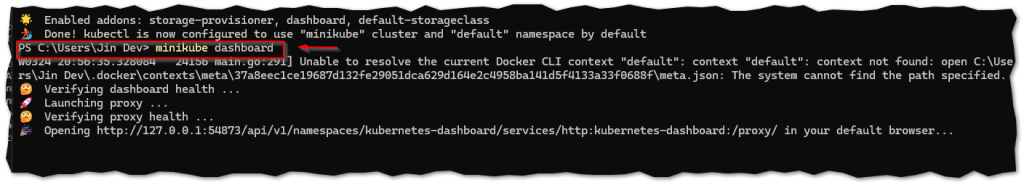
Of course, we can’t appreciate these pods and replica sets without seeing a good dashboard, which is the main objective in the first place. Just type “minikube dashboard.” It will eventually open a browser and show you the Kubernetes dashboard.
Now that we have set up and opened the dashboard, let’s try to navigate it by discussing it in the next section.
Navigating the Kubernetes Dashboard
In this section, let’s explore the main sections of the Kubernetes dashboard to get an idea of how to navigate and use it.
Cluster Section
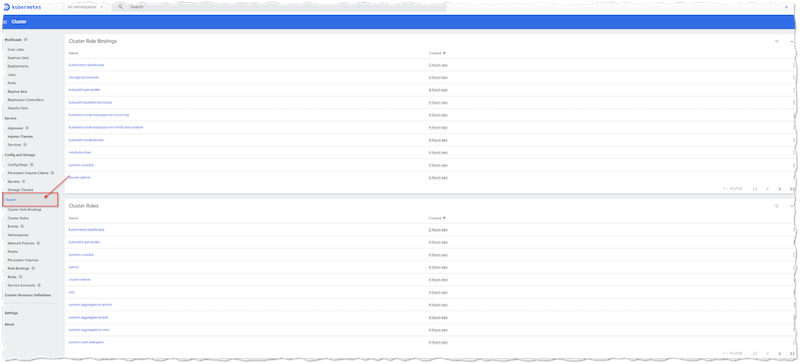
This section provides an overview of the Kubernetes cluster, including information about nodes and pod resource utilization metrics. In short, it provides a high-level summary of the cluster’s health and status.
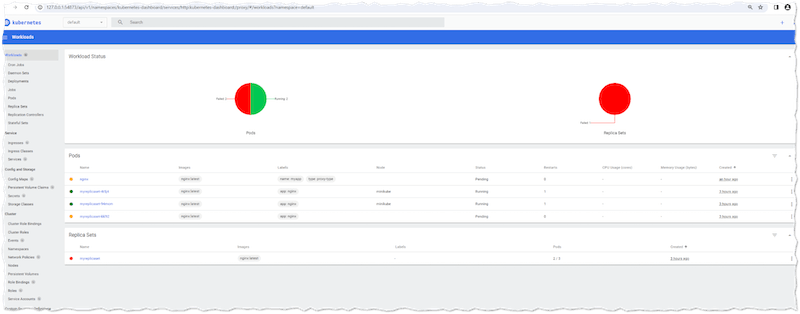
Workload Section
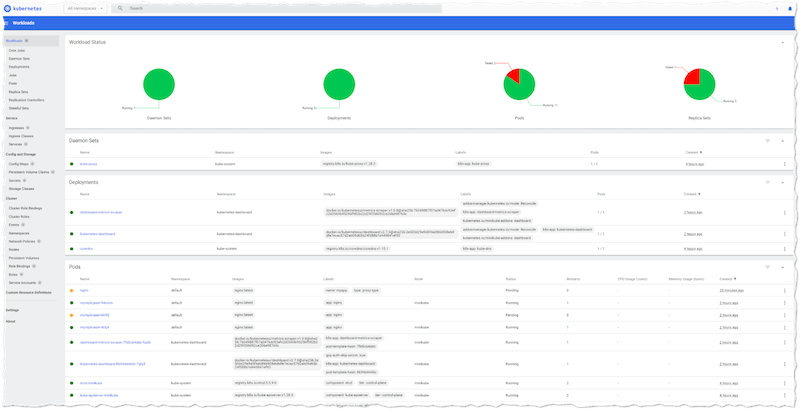
It allows you to manage your workloads, such as deployments and daemonsets, from within the dashboard.
Pod Section
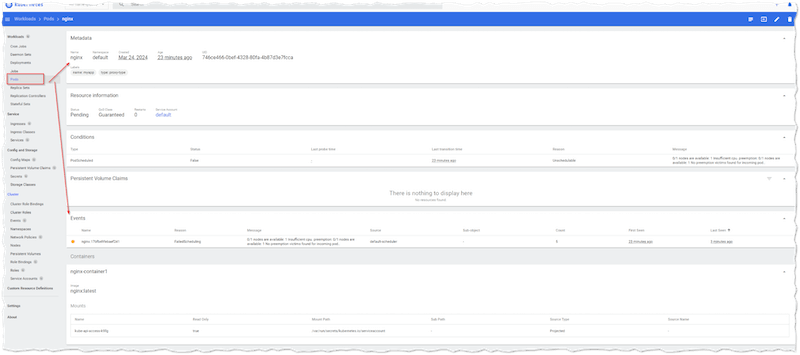
In the pod section, as DevOps guys, you can view and manage individual pods, which, of course, includes the logs and resource utilization of these pods.
Node Section
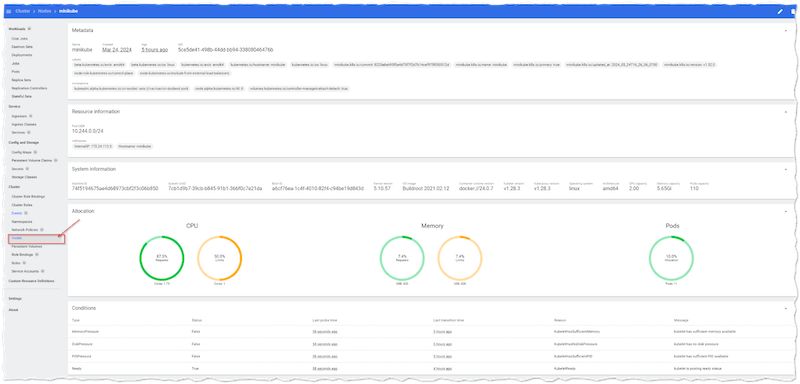
In the node section, you will see the real-time resource usage. If you are wondering what all that encompasses, you will essentially see the CPU and memory usage for each pod and node in the clusters you manage.
Namespace Section
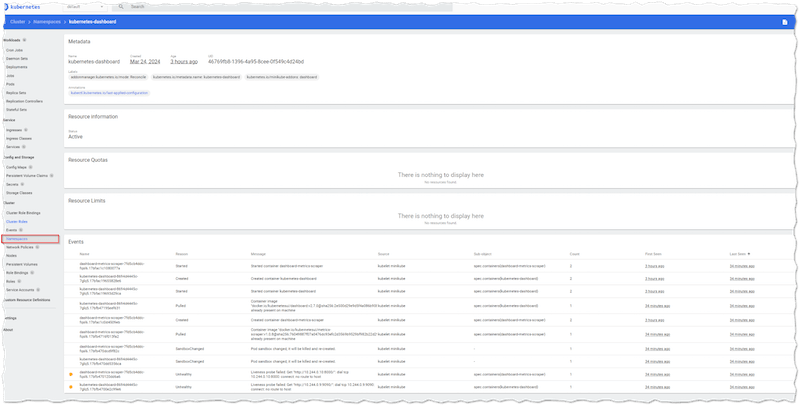
As a DevOps guy, you will find the namespace section helpful to enable and manage namespaces and their associated resources, such as pods and services.
Summary
Kubernetes dashboard offers a user-friendly web application for most administration tasks, making our life easier for those who prefer not to use CLI. Again, it doesn’t replace kubectl due to its limited functionality, nor does it serve as a comprehensive monitoring solution. That is why if you are cautious of the CLI, many tools offer different features and provide a GUI alternative for monitoring and observing Kubernetes clusters, addressing the gap in the dashboard’s capabilities.
Cover Photo by Luke Chesser on Unsplash